Overview | Usage | Account | Accessibility
The EyeOnWater app is organized into Overview, Usage, and Account pages. Tap a page icon to open that page.

Note: A notification badge will appear as a red dot on the Overview icon if there is an active leak alert for the selected meter.
Your EyeOnWater account name is displayed in the banner at the top of the screen. If you have more than one location linked to EyeOnWater, the navigation bar will indicate your current selection.

OVERVIEW
The Overview page is divided into sections for Alerts, Notices, Usage, and Customer Service, as shown in the numbered callouts below.


1 – Alerts
This section shows active leaks for your selected meter. NOTE: To take advantage of leak detection, use a web browser and follow these instructions to set a leak alert.
- Tap the alert notification card to view details. Tap < to return to the Overview page.


- Once a leak has ended, you will have the opportunity to answer an optional survey. Tap Next to begin. Feedback you provide is used by the app to help identify future causes of continuous usage.


- The badge on the Overview button at the bottom of the page will show the number of ongoing leaks for the selected meters.
2 – Unread Notices
View notices from your water utility.
- To view a notice, tap the Unread Notices section to open it. Tap Done to mark the notice as read and return to the Overview page or tap Mark as Unread to return to the Overview page and keep the notice unread.

- To view previous notices, tap View All Notices.


3 – Usage
The Usage section allows you to quickly compare your current usage to that of the past week, view a graph comparing your usage Last Week, This Week and 30-Day Average. Tap the Latest Usage card to open a detailed, interactive graph. Tap < to return to the Overview page.


4 – Customer Service
Use this section of the Overview page to access available contact information for your water utility’s customer service center.
- Tap Email to open a new email message addressed to your utility.
- Tap Pay My Bill to open your water utility’s bill pay website (if available).
- Tap Phone to start a call to your water utility.
- Tap Website to open your water utility’s website in your browser.
USAGE
The Usage page is divided into sections to view a Calendar and Graph of your water usage, and estimate potential savings using the Savings Calculator, as shown in the numbered callouts below.

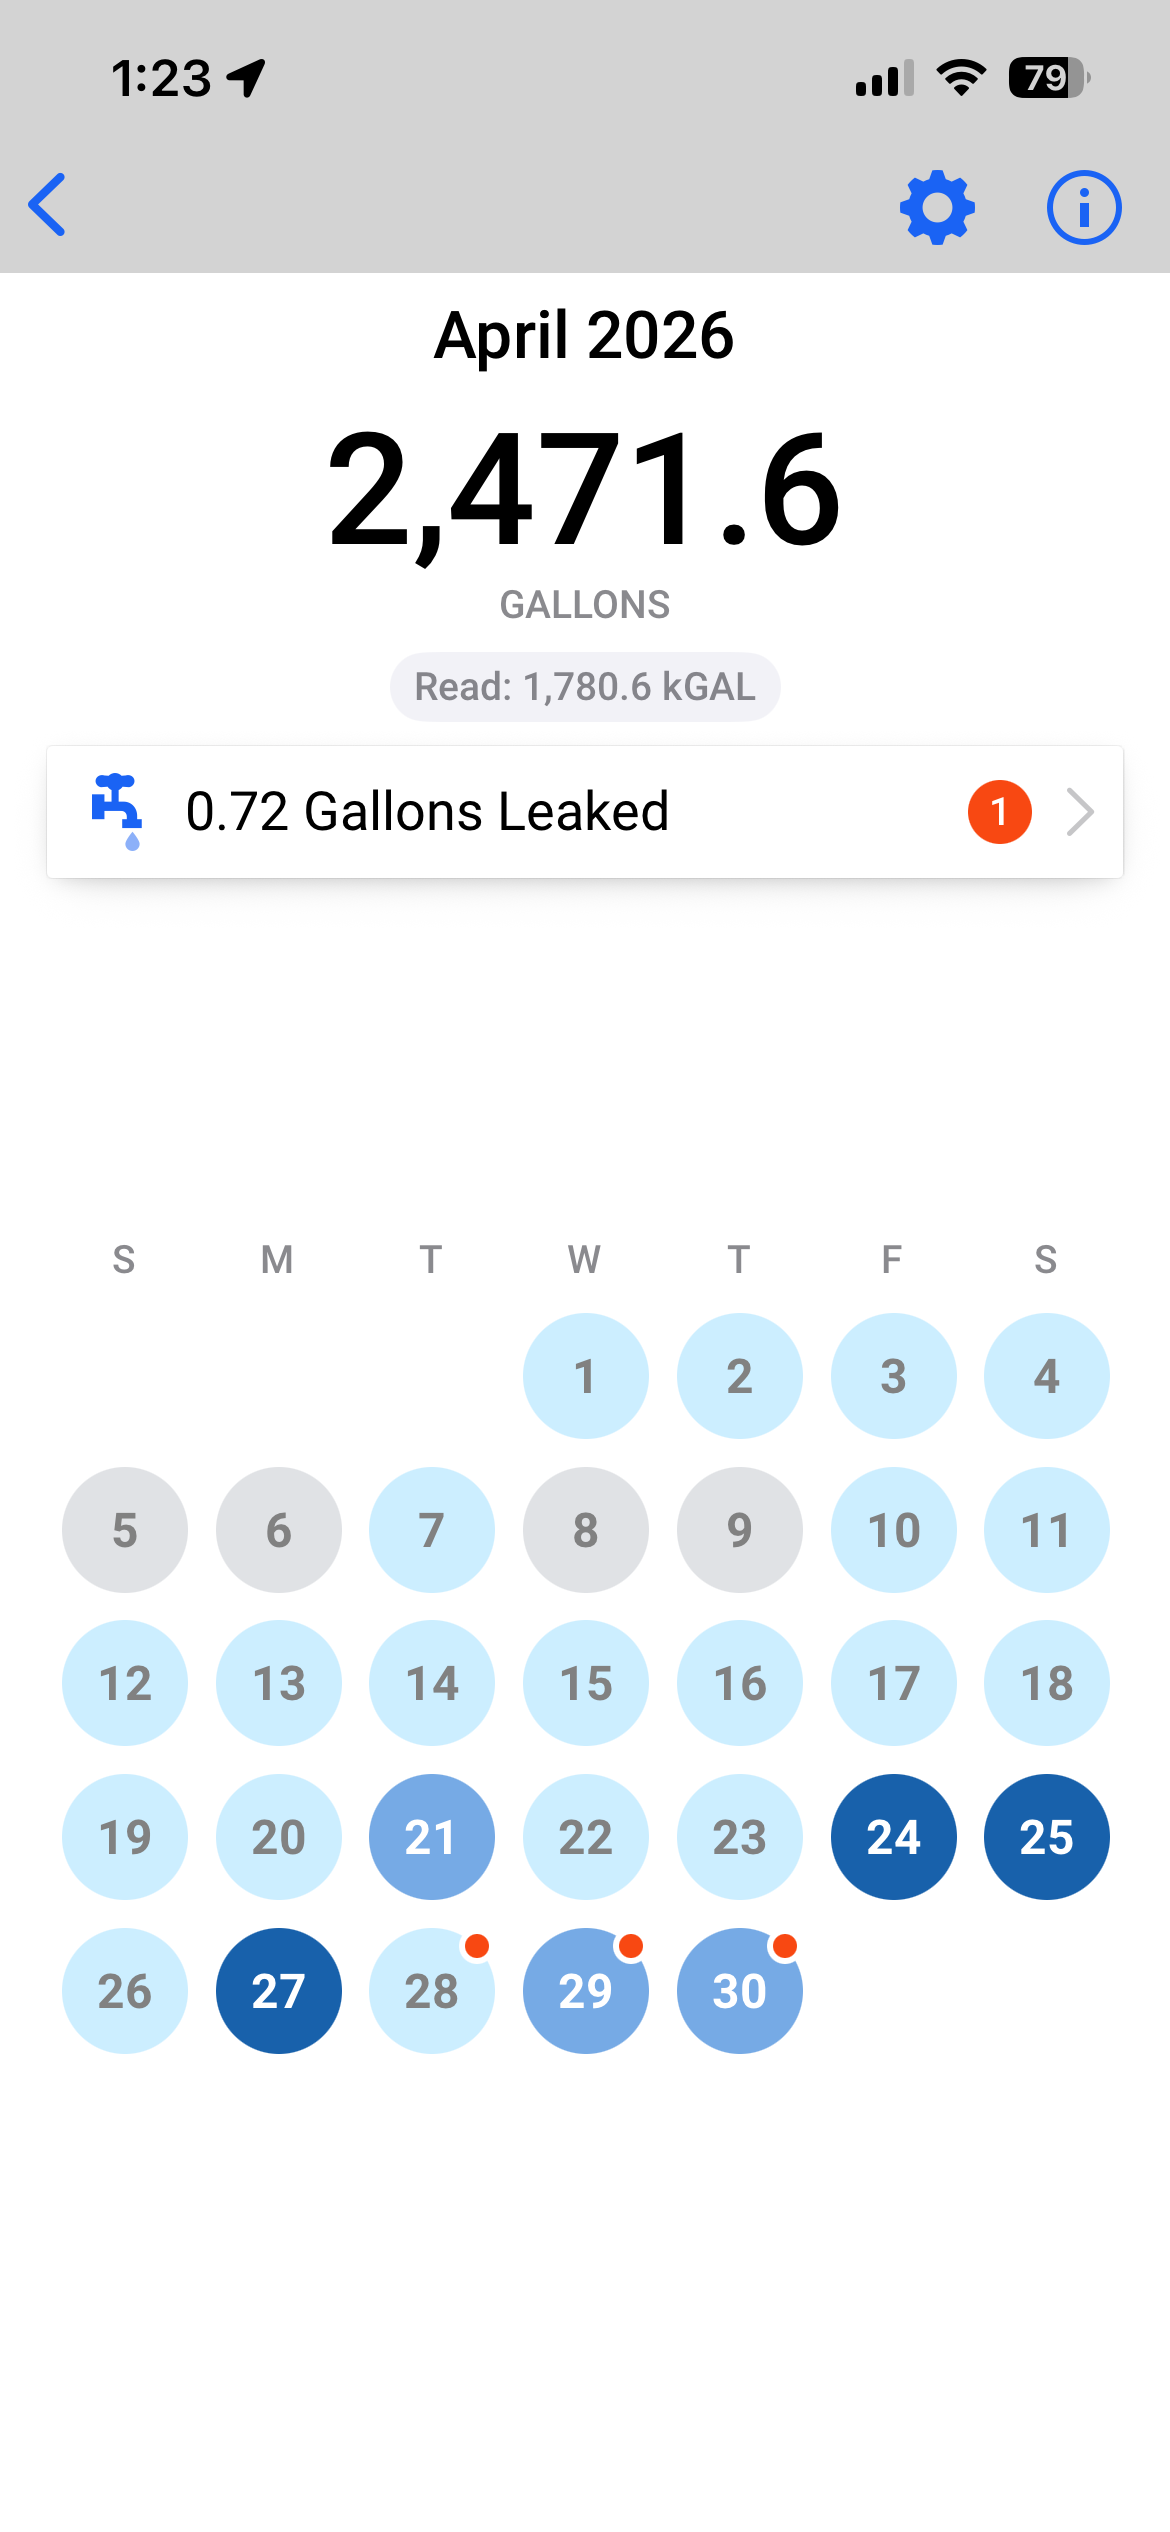
1 – Calendar
Tap the Calendar card to see your usage trends as a “heat map”. For each day, the color of each dot is determined by comparing that day’s consumption to a rolling average of the previous 30 day’s usage.
- Tap the ⓘ icon to open the Usage Key (legend).
- Swipe to scroll.
- Select a month to view usage for that month.
- Select a day to view usage for that day.
- Tap < to return to the previous screen.


2 – Graph
Tap the Graph card for a graphical view of your water usage.
A red dot in the upper-right corner of a bar indicates a leak was identified in that period (Week, Month, and Year views only). A leak banner appears above the graph. Tap the banner to view additional information, then tap Back to return to the graph.


Graph controls, navigation arrows, and settings are located at the top of the Graph screen.
![]()
- Page Navigation
- Tap < Back to return to the Usage page
- Graph Series Navigation
- Tap < and > on either side of the time series to move backward or forward a day/week/month/year.
- Graph Information
- Tap ⓘ to view graph information.
- Settings
Tap the Gear icon (top right) to open Graph Settings. Use the switches to turn settings on or off.- Show Axis Labels (iOS and Android) Toggles the visibility of Y-axis labels.
-
- Show Meter Reads (iOS and Android) When enabled, the most recent meter read for the selected time period will be shown near the top of the screen when viewing hourly or daily data. If a range of time is selected, the last meter reading for the selected time period will be shown.
- Autoscale Graph (iOS only) When enabled, the graph will automatically scale to reflect the visible data after selecting to a new time period. If autoscaling is disabled, you can pinch to zoom in/out.
- Tap Day, Week, Month, Year, or All below the graph to select how much data to display.
- Tap the calendar icon (bottom right) to change the date or date range displayed.
ACCOUNT
Use the Account page to view information specific to your Utility, Account and Location. NOTE: Locations can have more than one water meter. The meter(s) for each account will be listed in the card for the location. Their Meter IDs will be displayed in the Account Locations section.

1 – UTILITY
- Displays the name of your water utility.
2 – ACCOUNT
- Displays the Account Name and Account Number for the selected account. Tap the edit button to add or edit your nickname for the account.
3 – LOCATION
- Displays the location name and address, meter details and user-entered location profile associated with your water meter. Tap > to view more information and Back to the main Account screen.
-
-
-
-
- Enter a user-entered location profile (optional) about the property associated with your account. This information is used in savings estimate calculations in the app. Tap the location details section to create a location profile. Enter or update the information, then tap Save to save changes or Cancel to return to the Account screen without saving.
-
-
-
-


ACCESSIBILITY
Both iOS and Android versions of the EyeOnWater support accessibility features offered by their respective operating systems. These include support for a screen reader, display and font size enhancements, contrast and color options, interaction controls, braille display and keyboard support, and more. For details start with these web pages from Apple (iOS Accessibility) and Google (Android Accessibility).
Tagged with: account, calender, consumption graph, Overview, savings calculator, Usage
Posted in EyeOnWater, Uncategorized
